
TL;DR;
California's statewide risk stratification capability can become an important tool for population health management programs. However, organizations should ensure that the design decisions made in standardizing a statewide approach do not inadvertently compromise regional operational utility.
THE GREAT
- Many predictors in the RSST can easily be replicated, in more real-time through the use of EHR and/or HIE data to allow for more immediate identification and internal tiering. The State's commitment to transparency may result in documentation that can serve as starting points.
- The RSST focuses on prospective identification of adverse events, rather than using historic utilization to risk stratify patients into risk tiers.
- The methodology specifically includes underutilization as a risk outcome, a feature not available in many open-source or commercial models.
THE NOT SO GREAT
- Only ~10% of the statewide population can be considered high risk at any point in time. Although the reasoning behind this decision is commendable (account for capacity constraints), it represents a rather arbitrary cutoff that may leave some medically and socially complex members out of scope for more intense population health management programs.
- Because of the statewide lens in risk tiering, there may be disproportionate distribution of high risk across regions, decreasing utility of risk tiers for some plans and providers.
- Some predicted outcomes have less operational utility due to underlying definitions (i.e. all-cause ED visits that include large proportions of necessary and unavoidable ED utilization, housing instability via z-codes or address).
As part of its Medicaid (Medi-Cal) Transformation (California Advancing and Innovating Medi-Cal - CalAIM), the California Department of Health Care Services (DHCS) has been working with a variety of academic and industry stakeholders on establishing a statewide risk stratification algorithm to standardize how the State uses risk intelligence to manage its Medicaid program. This past July, DHCS released the most comprehensive information to-date on its Risk Stratification, Segmentation, and Tiering (RSST) approach. And it contains a treasure trove of information for accountable care organizations (ACOs), managed care plans (MCPs), as well as the broader population health management & analytics community. What does it mean for providers and health plans? Let's dive in!
What Is It? What Is It Supposed to Do?
The RSST is the State's response to a largely decentralized strategy for risk stratification in California. Although MCPs are required to risk stratify patients as part of their population health management programs, the State gave MCPs independence on methodology selection, leading to the use of disparate tools and wide variability in how members are identified for programs and services.
As of July 2025, MCPs across California have access to a standard set of risk intelligence tools that predict adverse events, utilization, and social risk. Generally, the intent of the RSST is to identify Medi-Cal members who are most likely to benefit from proactive services and outreach (read: members who are at increased risk for certain outcomes). While this is a big win for smaller plans that have struggled to stand up more complex risk identification & stratification infrastructure, it also poses some challenges in operationalizing a dataset that focuses on statewide population health management that is more policy-aligned than some health plans or ACOs may appreciate.
How Does It Work?
Version 1.0 of the RSST provides risk intelligence on adults (18+ years) and children (4 months to 17 years), and tiers the population into three groups: LOW, MEDIUM-RISING, and HIGH. Future versions may include birthing populations as well (pregnant or up to 12 months post-partum, and infants 0 to 3 months). To be classified as HIGH RISK, a member must be in the top ~10% of the population based on an aggregate risk score. This 10% cutoff was determined primarily based on stakeholder input on MCP capacity to deal with a high-risk population. DHCS did not specify whether this is 10% at the state level, or across geographic strata, however, based on their intent to approach the problem using a statewide lens, it's likely that 10% is of the entire statewide Medi-Cal membership.
| HIGH | The top ~10% of the statewide Medi-Cal population that had the highest true positive rate (recall) within a tolerance of ±2% of a minimum recall value. |
| MEDIUM-RISING | Members with predicted risk scores that have a recall threshold of at least 50%. This means that of 100 true cases, the models were able to identify 50. |
| LOW | The remainder of the population, where models performed worse than 50% recall (they identified less than 50% of the cases / outcomes). |
Predictors
Using Medi-Cal claims and eligibility, this monthly process uses four primary types of predictors to generate risk probabilities across five main risk domains. For predictive variables, DHCS uses:
- Socio-Demographic Risk Factors: including geographic, demographic, and social subdomains, including information such as age, race, gender, employment status.
- Prior Use: includes physical, behavioral, and social health domains, with information related to chronic condition diagnoses, as well as healthcare service utilization.
- Transition Events: focused on both medical and non-medical event types, including indicators such as switching Medi-Cal plans, moving counties, aging into the adult population, etc.
- Outcomes as Risk Factors: certain outcomes (such as ED visit history) also serve as great predictors for healthcare service use.
Interestingly, the algorithm makes use of both person-level, as well as community-level predictors. For example, crowding, median income, education, transportation, and poverty variables from the American Community Survey (ACS) at a zip code (ZCTA) level are inputs into the model. No information was made available on the value these community-level variables add to predicting adverse health outcomes.
Outcomes
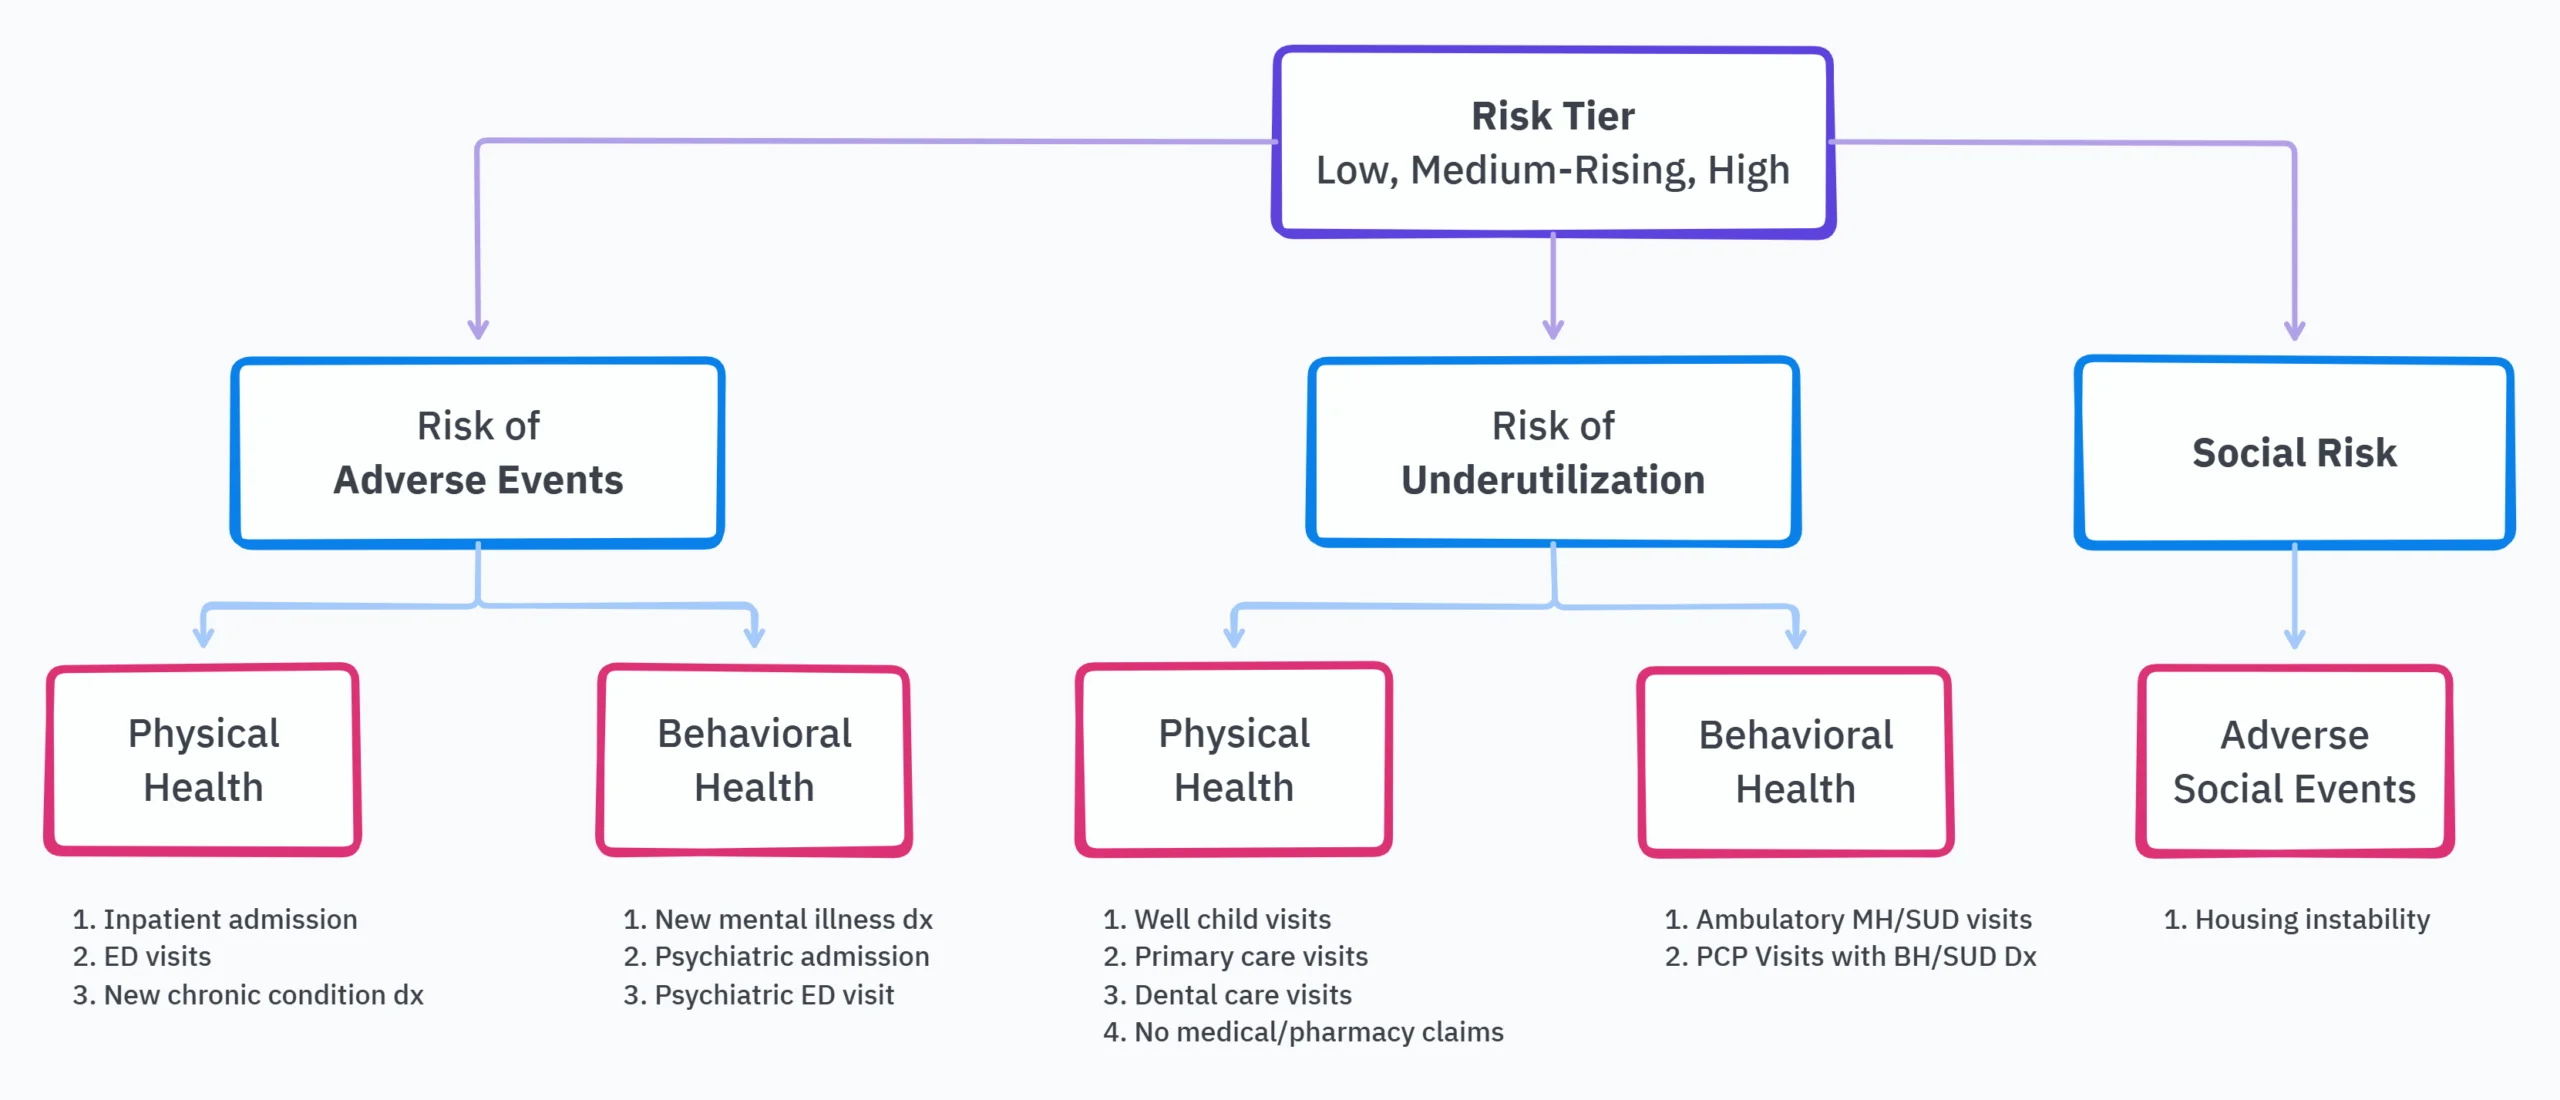
The tiering algorithm focuses on predicting three types of risks: the risk of adverse events, that of underutilization, and social risk (mainly housing instability as of V1.0). Adverse events and underutilization are each further broken down into physical and behavioral health to give a total of five risk domains. Because adult populations have different risk profiles when compared to pediatric populations, the same risk domain or subdomain will yield a different set of predicted outcomes. The figure below provides a high-level breakdown of domains, subdomains, and the underlying outcomes that generate a risk score. A more extensive list of outcomes is available on pages 32 - 37 of the transparency document.
Although the full list of predicted outcomes is a mile long (and that's a GOOD THING!), a few caught our attention as either increasingly useful for provider groups and frontline teams, while others gave us reason to question immediate clinical or operational value.
| Population | Outcome | Definition | So What? |
| Adults | Morbidity | A net new increase of ≥ 1 in Charlson Comorbidity Index (CCI) count, indicating a departure from physiological or psychological wellbeing (we read 'baseline'). | This can not only be easily replicated by ACOs and primary care provider groups using more real-time EHR data, it is also a simple and easily explainable measure of "rising risk." |
| Adults | Three or More All Cause ED Visits | Y/N indicator that a member had 3 or more visits to an ED or ED setting in a 12 month period, regardless of the primary reason for the visit. | Not all ED visits are avoidable, and not all ED visits are primary care treatable. In fact, almost a third of ED visits are appropriate and necessary. This has the potential to send primary care organizations down rabbit holes with little value at the end of the journey. |
| Adults | Underuse of Primary Care Visit | Among adult members who had at least 1 ED visit or inpatient admission in the 12 months prior to index date, Y/N indicator that the member did not have at least 1 outpatient visit to a primary care provider in the next 12 months. | This creates a blanket requirement that all ED visits require a primary care visit post discharge. Although useful for multi-morbid populations, the lack of ability to further discern between primary care treatable vs. necessary ED visits, and the reason for ED visit, reduces the ability for population health teams to sequence the right patients for outreach & engagement. |
| Adults | Housing Instability | DHCS business logic measuring a proxy of housing instability using a combination of ICD-10 z-codes, as well as how an individual's address is classified upon Medi-Cal enrollment, and the type of address used (e.g. homeless shelter, group housing). | ICD-10 Z-codes are still underutilized. While some systems are getting better at capturing social risk factors (such as housing) through screenings, this may not always translate into a Z-code. This is a significant missed opportunity for DHCS to use housing databases (HMIS) to enhance the utility of this metric. For primary care organizations, there is a tremendous opportunity to enhance this with internal, EHR data, and text classification from clinical notes. |
| Pediatric | Morbidity | Y/N indicator of a pediatric patient's movement to a level of higher medical complexity during a rolling 12-month post-index period, as defined by the Pediatric Medical Complexity Algorithm (PMCA). | This is another excellent example of a segmentation/stratification methodology that could be easily replicated by primary care groups and ACOs using more real-time EHR data. |
How Does a Composite Risk Tier Get Assigned?
All models used predict a binary outcome (Y/N, whether an event or outcome is likely to happen). Although defining the top 10% simply based on ranked scores would have produced easily explainable results, that methodology has the risk of disproportionately identifying members that would now be considered "high risk," but not actually go on to have a poor outcome.
Aggregate / composite risk tiers are calculated at multiple levels:
- At the subdomain level (i.e. Risk of Adverse Events - Physical Health), individual model predictions create a composite risk score with corresponds to risk tier (based on recall/true positive rate).
- One level up, at the domain level (i.e. Risk of Adverse Events), the highest subdomain risk tier becomes that domain's risk tier.
- At the overall, person level, the highest domain risk tier becomes that individual's overall risk tier.
Simply put, a person's highest subdomain risk tier becomes their overall risk tier. For example, a member classified as high risk under the social risk domain (due to being high risk for adverse social events / housing instability) would be classified as high risk overall. Similarly, a member classified as high risk for behavioral health adverse events would also be classified as high risk overall.
How Does It Compare to Commercial Products?
In isolation, the various domain-level models (i.e. adult physical health adverse events) show good performance across a variety of metrics (page 48). This includes metrics such as:
- Area Under the Curve (AUC): measures true positive rate against false positive rate, with anything over 0.5 being better than "random chance," and a score of 1 being a perfect model.
- Accuracy: measures the proportion of predictions that were correct as an overall measure of performance. 100% means all predictions were correct.
- Precision: a measure of reliability, calculating what percentage of all identified positives were actually positive.
- Recall: another measure of reliability that captures the proportion of true positives of all cases that were predicted to be positive.
- Specificity: measures the ability of a model to accurately identify true negatives - those members or cases that do not have an outcome. Specificity becomes increasingly important in cases where incorrectly identifying someone as positive can produce unintended harm.
To compare against other models, DHCS used several studies from published literature for specific outcomes (see the last page - References). To provide another point of reference, we use a report from the Society of Actuaries - a comprehensive review of claims-based risk scoring models. Several open source and commercial products were included in the analysis, including the Hopkins ACG system, CDPS, the HHS HCC Model, Impact Pro, and others. Although DHCS did not release outcome-level performance data to enable direct comparison, there is some similarity in performance when identifying a top proportion of the population.
| Outcome | Notes | RSST | ACG | DxCG | Optum | Wakely | MARA |
| Top x% | SOA study measured the top 1% highest cost, while RSST measures top 10% by recall. | 0.81 - 0.94 | 0.86 | 0.87 | 0.87 | 0.86 | 0.88 |
Several models/products are missing from the table above. Notably: Truven/IBM as the product may have changed since the comparison was made, as well as CDPS, as it performed significantly worse in prospective models. It's important to note that, while the comparison above can provide a high-level point of reference, it is not a one-to-one comparison of model performance and does not directly compare the performance of model predictions on the exact same outcome. Use the above as a point of reference, not as a point of comparison.
So What?
Having access to a standardized approach to risk stratification and tiering is no doubt a major win for MCPs, ACOs, and other primary care provider groups across California. For organizations that have a larger geographic footprint, or those serving populations in major urban / densely populated regions of the state, this new methodology will likely greatly contribute to their ability to identify and sequence the right patients for outreach and enrollment into eligible population health management programs.
Beyond it's out-of-the-box utility, the State's commitment to transparency will likely yield additional documentation that could ignite, support, and enhance local risk stratification efforts, especially for organizations with smaller populations, or those with more immature risk stratification practices.
For Managed Health Plans (MCPs), who are the first to gain access to this data, a significant next step will be to compare the output and performance of this methodology with existing tools and products in order to enhance or replace risk tiering capabilities. But don't throw the baby out with the bathwater just yet.
For provider groups, especially those that have engaged in global risk contracts, the methodology provides several, operationally useful, predictors that could be replicated in more real-time using EHR, care management, or HIE data. Because RSST data is not yet available to providers, organizations should consider requesting this data from their partnering MCPs while the State broadens the scope of access.
For organizations with smaller or immature population health analytics programs, this will become an important toolkit to inform outreach, engagement and referral decisions for health management programs.
An "openly accessible" risk stratification algorithm with statewide coverage is a significant win for MCPs and for population health in California. As data exchange initiatives continue to evolve and progress, the RSST should see improvements over time in the diversity of data used in the development of risk tiers.